
Stroud district's average home fell £3,863 in September to £350,788, the first annual fall since January. Flats are down 3.4% on a year ago.
The average home in Stroud district was worth £350,788 in September. That is £3,863 less than in August, a fall of 1.1% in a single month.
The figures come from the UK House Price Index, which HM Land Registry published on Wednesday 18 November.
Over the year the district average is now down £3,620, or 1.0%, on September 2025. It is the first time Stroud has been lower than a year earlier since January 2026, when the annual change was minus 0.9%.
UKHPI is a mean average, not a median. A few expensive sales can move it, so the direction over several months matters more than one release.
Why the annual figure turned
Part of the fall is about last year, not this one. In September 2025 the Stroud average jumped 2.5% in a single month, from £345,846 to £354,408. This September is being compared with that high point.
August, which we did not report at the time, had gone the other way. The average rose 1.5% that month to £354,651, the highest figure in the series for at least the last year. September took back most of that rise.
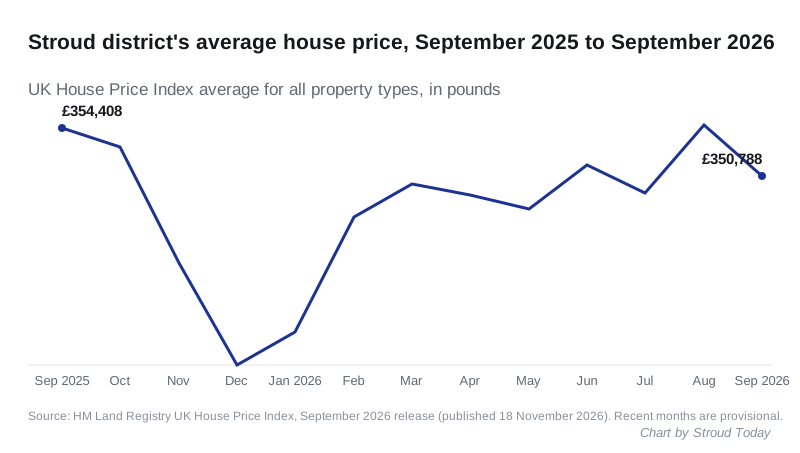
The monthly averages behind the chart:
| Month | Stroud district average |
|---|---|
| September 2025 | £354,408 |
| December 2025 | £336,429 |
| March 2026 | £350,186 |
| June 2026 | £351,636 |
| July 2026 | £349,504 |
| August 2026 | £354,651 |
| September 2026 | £350,788 |
Every type of home fell in the month
Detached houses, semis, terraces and flats all lost between 1.0% and 1.2% of their value in September. Over the year:
| Type | Average price, September 2026 | Change over 12 months |
|---|---|---|
| Detached | £553,816 | -1.0% |
| Semi-detached | £337,319 | -0.1% |
| Terraced | £283,696 | -1.1% |
| Flat or maisonette | £164,017 | -3.4% |
Flats have fallen furthest. A year ago the district flat average was £169,810, so the typical flat is worth £5,793 less than it was.
Semis have held up best and are almost exactly where they were in September 2025, at £337,319 against £337,800.
The first-time buyer average is £287,694, down 0.8% on the year. Somebody moving from one home to another paid an average of £405,911, down 1.1%. The gap between the two is £118,217.
How Stroud compares with the rest of Gloucestershire
Every district in the county fell in September. Over the year, three are lower and three are level or higher:
| District | Average, September 2026 | Change over 12 months |
|---|---|---|
| Cotswold | £424,819 | -2.9% |
| Stroud | £350,788 | -1.0% |
| Cheltenham | £326,607 | 0.0% |
| Tewkesbury | £321,761 | +0.4% |
| Forest of Dean | £293,712 | -1.0% |
| Gloucester | £238,231 | +2.7% |
Stroud and Forest of Dean are both down 1.0%. Only Cotswold has fallen further.
Gloucester is the one district still clearly rising. A Stroud district home now costs £112,557 more than a Gloucester one.
The wider figures are flat to slightly up:
- Gloucestershire as a county: £317,210, down 0.2% on the year
- the South West: £301,616, up 0.3%
- England: £292,998, up 0.8%
Stroud remains the second most expensive district in the county, behind Cotswold.
What it means for you
If you are selling. A 1% annual fall is small, and the district is still about 6.6% above its 2023 level on the index. But the run of rises that Stroud enjoyed through the spring has stopped, and every Gloucestershire district fell in the same month. Asking prices based on what a neighbour got in the summer may need a second look.
If you own a flat. Flats are down 3.4% on the year in the district. That is in line with the national trend: across England, flats and maisonettes were down 3.3% over the same period.
If you are buying your first home. The first-time buyer average of £287,694 is £2,425 lower than a year ago. That is a modest easing rather than a fall that changes what most buyers can afford.
If you are checking your council tax. House prices have no effect on your band, which is still set on April 1991 values. What each band costs this year is on our Stroud council tax bands page.
These figures will be revised
Land Registry restates every month as late sales are registered. The September figure is a first estimate and will very likely change.
That has already happened to the July figures we reported in September. We gave July as £351,736 with an annual rise of 2.9%. July now reads £349,504 and +2.2%. A correction note has been added to that article.
Sales counts lag furthest of all. The latest month counted for Stroud is July 2026, with 135 sales. August and September are not yet counted.
The next release, covering October, is due in December. The district’s prices by town and street are on our Stroud house prices page.
Sources: HM Land Registry UK House Price Index, September 2026 release, for Stroud, Cheltenham, Cotswold, Forest of Dean, Gloucester, Tewkesbury, Gloucestershire, the South West and England, from the full UK HPI data file, retrieved 18 November 2026. Contains HM Land Registry data © Crown copyright and database right 2026, licensed under the Open Government Licence v3.0.
Have your say