
Stroud district had 1,595 claimants in August, up 115 on a year: Gloucestershire's biggest rise. Claims by 16 to 24s rose 28%, against 10% across the UK.
Stroud district had 1,595 people claiming unemployment-related benefits in August 2026. That is 115 more than in August 2025, and 75 of the extra claimants are aged 16 to 24.
The district’s rate is still low. It is 2.1 per cent of residents aged 16 to 64, against 2.7 per cent across the South West and 3.9 per cent across the United Kingdom. But no other Gloucestershire district added as many claimants over the year, in number or in percentage terms.
The Office for National Statistics released the figures on 15 September 2026, through nomis.
Young claimants drove the rise
Year on year, across Stroud district:
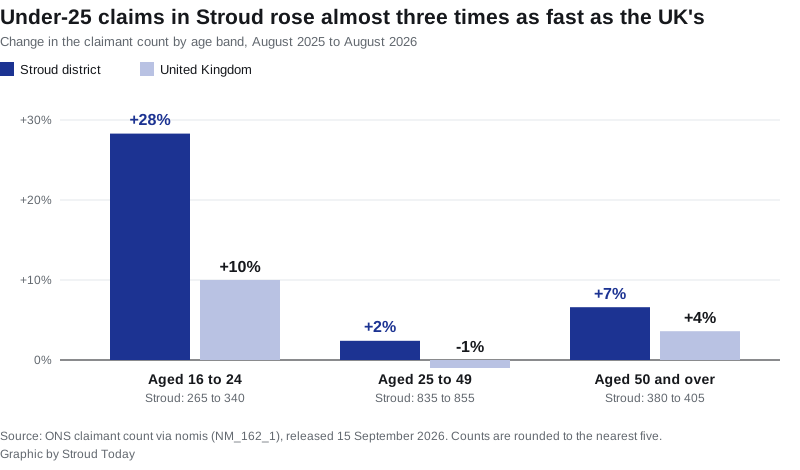
- Aged 16 to 24: up from 265 to 340, a rise of 75, or 28 per cent
- Aged 25 to 49: up from 835 to 855, a rise of 20, or 2 per cent
- Aged 50 and over: up from 380 to 405, a rise of 25, or 7 per cent
The same age group grew by 10 per cent across the United Kingdom, from 312,115 to 343,395. Claimants aged 25 to 49 fell by 1 per cent nationally.
The three age bands add up to a rise of 120, not 115. That is rounding: the ONS rounds every count to the nearest five before publishing, so small local changes are approximate.
This is more than the usual August bump
Claims by young people often tick up in August, when school and college leavers start looking for work. Stroud’s figures show that pattern in earlier years, but on a much smaller scale.
- July to August 2024: 16 to 24 claimants went from 230 to 240, up 10
- July to August 2025: from 260 to 265, up 5
- July to August 2026: from 305 to 340, up 35
Men account for 65 of the year’s extra claimants, up from 745 to 810. Women account for 45, up from 740 to 785.
Stroud against the rest of Gloucestershire
| District | Rate, Aug 2026 | Aug 2025 | Aug 2026 | Change |
|---|---|---|---|---|
| Stroud | 2.1% | 1,480 | 1,595 | +115 (+7.8%) |
| Tewkesbury | 2.4% | 1,335 | 1,425 | +90 (+6.7%) |
| Cotswold | 2.1% | 1,025 | 1,090 | +65 (+6.3%) |
| Gloucester | 3.5% | 3,050 | 3,150 | +100 (+3.3%) |
| Forest of Dean | 2.6% | 1,335 | 1,375 | +40 (+3.0%) |
| Cheltenham | 2.7% | 2,120 | 2,095 | -25 (-1.2%) |
Stroud and Cotswold share the lowest rate in the county, at 2.1 per cent. Cheltenham is the only district where the number fell. Across the UK the count rose 2.1 per cent over the year, and across the South West 3.9 per cent.
Stroud Central is now second of 138 wards
Ward figures show the same split we reported for July. The district average hides a town centre with one of the highest rates in the county.
- Stroud Central: 5.8 per cent, 80 claimants. Only Barton and Tredworth in Gloucester, on 5.9 per cent, is higher among Gloucestershire’s 138 wards.
- Stroud Slade: 5.1 per cent, 85 claimants, joint sixth in the county with Moreland in Gloucester.
- Stroud Valley: 3.4 per cent, up from 2.9 per cent in July.
The lowest rates in the district are in Kingswood, on 1.0 per cent, and in Bisley and in Amberley and Woodchester, both on 1.1 per cent.
The biggest single move over the month was in Cainscross, where claimants went from 105 to 130 and the rate from 2.1 to 2.7 per cent. Stroud Uplands went from 2.1 to 2.8 per cent. Most other wards moved by five claimants or fewer, which is within the rounding.
July’s figure has been revised down
When the July figures came out in August, the ONS put Stroud district on 1,600 claimants and 2.2 per cent. In this release it has revised July to 1,570 and 2.1 per cent. So the rise from July to August is 25 on the revised figure. Revisions to the latest months are routine with this data.
What the claimant count measures
This is not the unemployment rate. The ONS says the claimant count measures “the number of people claiming benefits principally for the reason of being unemployed, based on administrative data from the benefits system”. It “does not attempt to measure unemployment”, which is defined differently.
Since Universal Credit, the count also includes some people who are in work on low earnings and are required to look for more. So a rise can mean more people out of work, more people on low hours, or both.
What it means for you
- If you are 16 to 24 and looking for work, you are in the only age group in the district that has grown sharply this year. The help available when moving from benefits into work is set out on gov.uk.
- If you are job hunting in Stroud town, the competition is stiffer than the district figure suggests. Stroud Central and Stroud Slade together have 165 of the district’s 1,595 claimants.
- If you employ people in the district, the pool of young applicants is larger than it was a year ago.
- If you live in the town centre, council services for residents on lower incomes include council tax support of up to 100 per cent for working-age households. Band charges for every parish are on our council tax page.
The September 2026 figures are due from the ONS on 20 October 2026.
Sources
- Claimant count by sex and age, ONS via nomis, dataset NM_162_1, August 2026 release (updated 15 September 2026), for every count, rate, age band, sex split and ward figure in this article. Stroud district is E07000082; ward figures cover all 138 Gloucestershire wards.
- Claimant Count QMI, Office for National Statistics for what the claimant count measures.
Have your say