
Stroud Central's claimant rate is 5.7%, joint second of the county's 138 wards. Bisley, Amberley and Painswick are on 1.2%. The district average of 2.2% hides both.
Stroud district looks like one of the calmer corners of the country for unemployment. In July 2026 there were 1,600 people claiming unemployment-related benefits, or 2.2 per cent of residents aged 16 to 64. That is below the South West’s 2.7 per cent and well below the United Kingdom’s 3.9 per cent, and it is the second lowest rate of Gloucestershire’s six districts.
Break the district into its 27 wards and the picture changes completely.
Stroud Central is on 5.7 per cent. That is joint second of all 138 wards in Gloucestershire, level with Hesters Way in Cheltenham and behind only Barton and Tredworth in Gloucester on 6.1 per cent. It is higher than the rate in any Gloucestershire district, including Gloucester itself on 3.6 per cent, and higher than the UK average.
Three wards in the same district are on 1.2 per cent: Painswick and Upton, Amberley and Woodchester, and Bisley.
All figures here are the ONS claimant count for July 2026, published through nomis on 19 August 2026.
The rise is concentrated in the town
Ward-level claimant figures only run back to January 2026, so seven months is as long a view as the data allows. In that time the district total barely moved. What did move was Stroud town.
- Stroud Central went from 4.2 per cent to 5.7 per cent, a rise of 1.5 points
- Stroud Slade went from 3.8 per cent to 4.8 per cent, up 1.0
- Rodborough went from 1.5 per cent to 2.5 per cent, also up 1.0
- Stroud Farmhill and Paganhill went from 2.3 per cent to 3.0 per cent, up 0.7
Eleven of the 27 wards fell or stayed flat over the same seven months. The largest fall was in Stroud Trinity, down 0.9 points from 4.1 per cent to 3.2 per cent, which is the one town ward moving the other way.
Five of the district’s six highest wards are Stroud town wards. The sixth is Dursley, on 2.6 per cent.
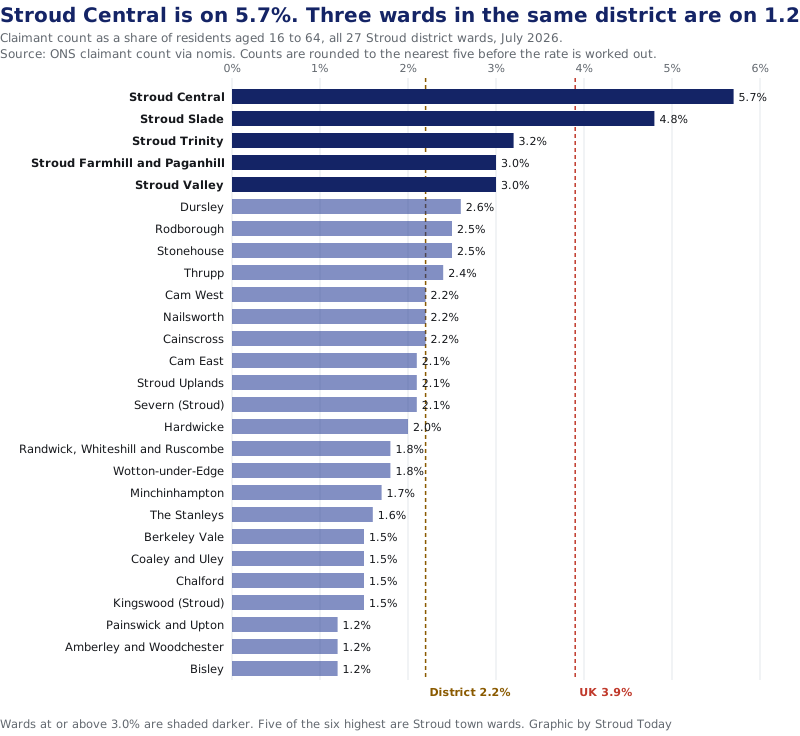
Every ward, July 2026
| Ward | July 2026 | January 2026 | Change, points |
|---|---|---|---|
| Stroud Central | 5.7% | 4.2% | +1.5 |
| Stroud Slade | 4.8% | 3.8% | +1.0 |
| Stroud Trinity | 3.2% | 4.1% | -0.9 |
| Stroud Farmhill and Paganhill | 3.0% | 2.3% | +0.7 |
| Stroud Valley | 3.0% | 3.3% | -0.3 |
| Dursley | 2.6% | 2.3% | +0.3 |
| Rodborough | 2.5% | 1.5% | +1.0 |
| Stonehouse | 2.5% | 2.6% | -0.1 |
| Thrupp | 2.4% | 2.1% | +0.3 |
| Cam West | 2.2% | 2.1% | +0.1 |
| Nailsworth | 2.2% | 2.5% | -0.3 |
| Cainscross | 2.2% | 2.2% | no change |
| Cam East | 2.1% | 2.2% | -0.1 |
| Stroud Uplands | 2.1% | 2.1% | no change |
| Severn (Stroud) | 2.1% | 1.8% | +0.3 |
| Hardwicke | 2.0% | 2.0% | no change |
| Randwick, Whiteshill and Ruscombe | 1.8% | 1.2% | +0.6 |
| Wotton-under-Edge | 1.8% | 1.9% | -0.1 |
| Minchinhampton | 1.7% | 1.9% | -0.2 |
| The Stanleys | 1.6% | 1.1% | +0.5 |
| Berkeley Vale | 1.5% | 1.7% | -0.2 |
| Coaley and Uley | 1.5% | 1.2% | +0.3 |
| Chalford | 1.5% | 1.2% | +0.3 |
| Kingswood (Stroud) | 1.5% | 1.8% | -0.3 |
| Painswick and Upton | 1.2% | 1.3% | -0.1 |
| Amberley and Woodchester | 1.2% | 1.5% | -0.3 |
| Bisley | 1.2% | 1.1% | +0.1 |
The 27 ward counts add up to 1,605 against a district figure of 1,600. That gap is rounding, not error. ONS rounds every claimant count to the nearest five before publication, which is also why the percentage changes below should be read as approximate rather than exact.
Young claimants rose faster here than nationally
The other movement in the July figures is in the youngest age group.
Stroud district had 300 claimants aged 18 to 24 in July 2026, up from 260 a year earlier. That is a rise of about 15 per cent. Across the United Kingdom the same age group went from 299,680 to 328,865, a rise of about 10 per cent. On rounded figures this small the exact percentage is soft, but the direction is not: young claimants grew faster in Stroud than nationally.
Every other age band in the district was close to flat. Claimants aged 50 and over went from 360 to 370 across the year, a rise of about 3 per cent. Under-25s account for 300 of the district’s 1,600 claimants, close to one in five.
Stroud against its neighbours
| District | Rate | Claimants | A year earlier |
|---|---|---|---|
| Gloucester | 3.6% | 3,165 | 3,095 |
| Cheltenham | 2.8% | 2,145 | 2,120 |
| Forest of Dean | 2.5% | 1,315 | 1,325 |
| Tewkesbury | 2.4% | 1,445 | 1,340 |
| Stroud | 2.2% | 1,600 | 1,510 |
| Cotswold | 2.1% | 1,080 | 1,025 |
Stroud’s rate is second lowest in the county. Its rise over the year is second highest. The district added 90 claimants, about 6 per cent, behind only Tewkesbury, which added 105. Forest of Dean was the only Gloucestershire district where the number fell.
What the claimant count does and does not measure
This is not the unemployment rate, and the difference matters when reading a ward figure of 5.7 per cent.
The claimant count records the number of people claiming unemployment-related benefits. Since April 2015 that has meant Jobseeker’s Allowance claimants plus Universal Credit claimants who are required to look for work. It leaves out anyone unemployed who is not claiming, and it includes some people who are working a small number of hours but are still required to seek more. The ONS designates the figures as experimental statistics, because it says the Universal Credit part of them is still being developed.
It is still the only measure available monthly at ward level, which is why it can show a gap inside one district that the headline figures cannot.
What it means for you
- If you are looking for work in Stroud, the district figure of 2.2 per cent understates the competition in the town itself. Stroud Central and Stroud Slade together account for 160 of the district’s 1,600 claimants.
- If you are under 25, you are in the only age group in the district that grew materially over the year, and the local rise outpaced the national one. Gloucestershire County Council’s adult education service runs courses across the county, and gov.uk sets out what help is available when moving from benefits into work.
- If you employ people here, the labour market in the valleys and the outlying towns is tighter than the district average suggests. Bisley, Amberley and Woodchester, and Painswick and Upton are all on 1.2 per cent.
- If you are reading a national story about Stroud house prices or wages, note that district averages are doing a lot of work. The average house price across the district sits above £350,000 while one of its wards has the county’s third highest claimant rate.
The next monthly release, covering August 2026, is due from the ONS in mid-September.
Update, 16 September 2026: in its August release the ONS revised Stroud district’s July 2026 claimant count from 1,600 to 1,570, and the rate from 2.2 to 2.1 per cent. Some ward figures were also revised, including Stroud Central (5.7 to 5.6 per cent) and Stroud Slade (4.8 to 4.9 per cent). The figures above are as first published. The August figures, with the revised July numbers, are in our August claimant count report.
Sources
- Claimant count by sex and age, ONS via nomis, dataset NM_162_1, July 2026, for every rate, count and age band in this article. Stroud district is E07000082.
- A guide to labour market statistics, Office for National Statistics for what the Claimant Count measures and why it is designated as experimental.
- Gloucestershire ward comparison drawn from the same dataset for all 138 wards in the county, July 2026.
Have your say